
Texas A &M has provided another great housing report on our state to keep you up to date with what’s happening in the real estate market. If you read through this and have any questions about what this means, or whether it’s a good time to sell your home, call Moira anytime at 817-343-5531.
April 2018 Summary
Housing supply factors flattened as Texas builders grappled with rising production costs. In response to structural imbalances in the single-family market, investment poured into multifamily structures to capitalize on the state’s population growth. Relentless demand for homes priced under $300,000 augmented single-family home shortages. On a positive note, home price appreciation moderated following a multiyear stretch of outpacing income growth. The gap between Texas’ income and home-price growth must continue to narrow to reverse waning affordability conditions.
Supply*
The Texas Residential Construction Cycle (Coincident) Index, which measures current construction activity, reached its highest level since 2008 as industry employment and construction values accelerated. This momentum should continue through the summer months as the Texas Residential Construction Leading Index (RCLI) extended its upward climb. Increases in multifamily building permits and housing starts offset the slacking single-family market, pushing the RCLI up almost a quarter of a percent year over year (YOY).
First quarter private bank loan data indicated sustained levels of residential construction investment in Texas. Developers invested record amounts in the apartment market, pushing multifamily loan values above $7.6 billion. Multifamily loans offset a slight decrease in one-to-four unit residential loans, which dipped 1.1 percent to $7.2 billion.
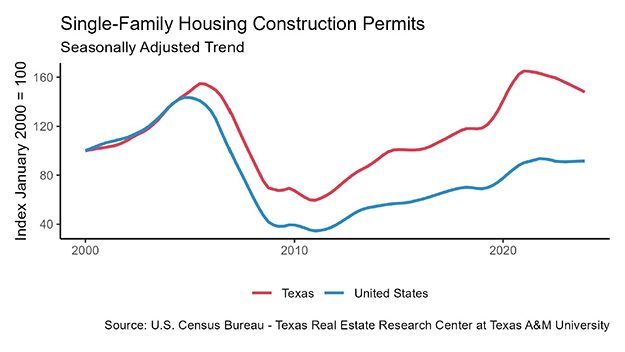
After abnormally large spikes during winter, the number of statewide single-family housing construction permits (unweighted) stagnated for the third consecutive month with 10,627 issued (nonseasonally adjusted). Permit activity typically peaks in the spring season. Texas still led the U.S. in permits issued, accounting for 15 percent of the national total. Houston remained the national metropolitan leader, issuing 3,596 nonseasonally adjusted permits this month and amassing 15.2 percent YOY growth. DFW ranked second in the nation with 3,072 monthly permits, led by growth in Tarrant County. Permit activity extended a yearlong stagnation in the Dallas-Plano-Irving metropolitan division. Austin held sixth place in the national ranking with 1,676 monthly permits after lagging last month. San Antonio permits fell back to 660 after last month’s temporary spike.
Total Texas housing starts jumped to 18,135 units, the most since 2006. Unlike last year’s early boom, the single-family market accounted for most of the increase despite sluggish building permits and loan values. The uptick in housing starts failed to boost single-family private construction values, which slid 8.6 percent on the year. Construction values dropped 19.1 and 18.8 percent year to date (YTD) in Austin and DFW, respectively, followed by San Antonio at 13.3 percent. In Houston, the reconstruction-related stimulus after Hurricane Harvey waned as single-family construction values decelerated from 13.6 to 3.1 percent YTD growth.
The Texas months of inventory (MOI) inched up to 3.5 months after reaching a record low in February. Around six months of inventory is considered a balanced housing market. Both the new- and existing-home markets experienced marginal relief, ending the month with 3.2 and 4.6 MOI, respectively. Improvements occurred primarily for homes priced above $300,000 where supply is more stable. For homes priced between $200,000 and $300,000, the MOI remained suppressed at 2.9 months, down 2 percent on the year; the MOI for homes priced under $200,000 sank for the eighth consecutive month to 2.7 months. These ultra-constrained price cohorts accounted for 69 percent of homes sold through Multiple Listing Services (MLS), illuminating the broad scope of the housing shortage.
All of the major metros except San Antonio exhibited a two-month uptick in housing inventory. Slow first-quarter sales activity lifted the MOI to 2.6 and 2.2 months in Dallas and Fort Worth, respectively. Similarly, decreased new-home sales lifted the Austin MOI to 2.5 months. Despite increased transactions in Houston, upward trending active listings pushed the MOI above 3.7 months. On the other hand, housing inventories tied a record low in San Antonio at 3.2 months amid a seven-month slide.
Demand
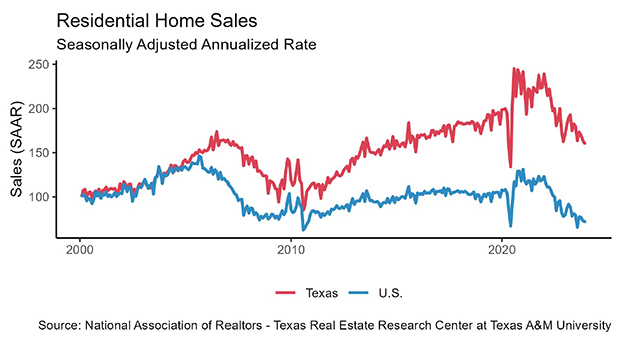
Housing sales picked up 3.4 percent after dropping 2.3 percent in the first quarter. Fort Worth and Houston led the charge with 4.9 and 4.8 percent growth, respectively, after disappointing numbers last month. The lack of available homes priced under $300,000 continued to hinder the Dallas market, extending a five-month sales decline despite healthy demand. While the trend has flattened, YOY sales maintained 2.7 percent growth. Similarly, Austin sales fell 6.7 YTD as housing affordability conditions worsened but upheld 5.6 percent growth YOY. San Antonio’s robust resale market pushed YTD sales above 5 percent. In fact, San Antonio sold a record high 2,263 existing homes through an MLS this month, outpacing Austin by over 160 transactions.
Total housing demand remained strong as activity shifted from the new-home to the resale market. The average days on market (DOM) dropped to 58 days in Texas after peaking above two months at the end of last year. The DOM fell to 55 days in Austin and 56 days in both Houston and San Antonio. North Texas remained the exception, where homes averaged just 43 and 39 DOM in Dallas and Fort Worth, respectively.
Statewide, homes priced from $200,000 to $300,000 flew off the market at an average of 52 days, compared to 87 days for homes priced above $500,000. Homes priced under $200,000 accounted for the largest proportion of sales through an MLS at 38 percent and averaged 60 days on the market. This bottom cohort, however, encompasses a diverse mix of sales across the state with varying market characteristics. For example, homes priced under $200,000 accounted for less than 10 percent of Austin’s sales but more than 75 percent in El Paso.
Robust economic data and rising inflation expectations supported higher interest rates. The ten-year U.S. Treasury bond yield reached 2.87 percent for the first time since 2013, while the Federal Home Loan Mortgage Corporation’s 30-year fixed-rate jumped up to 4.47 percent. Despite remaining historically low, rising mortgage rates threaten to augment housing affordability issues, particularly for first-time buyers.
Prices
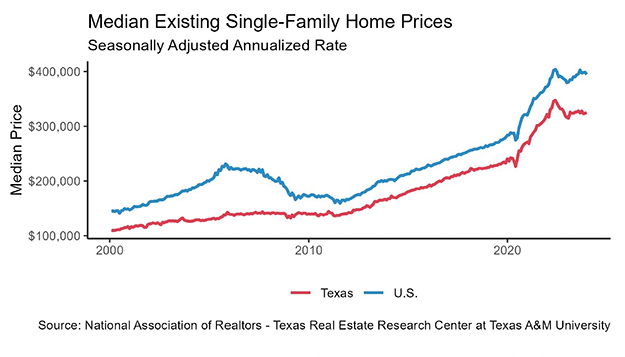
The divergence of Texas’ per capita income and housing prices challenged affordability conditions. The FHFA Housing Price Index indicated that Texas homes rose 1.7 percent in the first quarter, marking a 53 percent increase since 2007. At the national level, home prices increased just 14.5 percent over the same period. The major metros had even larger price spikes. Over the 11-year period, home prices rose 78 and 68 percent in Austin and Dallas, respectively. Dallas prices, however, ticked up just 0.6 percent in the first quarter, marking the slowest growth since 2011. The Fort Worth and Houston indices increased 3.0 and 1.1 percent, respectively, revealing a 60 percent increase relative to 2007 in both metros. Meanwhile, San Antonio prices crept up 0.4 percent, rising more than 45 percent above 2007 levels.
Despite the overall increase, the Texas median home price balanced around $230,000 for the fourth straight month. The median price actually decreased YTD in Austin ($302,255), Dallas ($280,831), and San Antonio ($217,484). In congruence with the FHFA index, the median price in Fort Worth and Houston rose 2.3 and 4.5 percent this year, respectively. A surge of resale activity stimulated the Houston market while pronounced shortages elevated prices in Fort Worth.
The statewide median price per square foot (ppsf) rose for the eleventh consecutive month to $115.17. Houston’s ppsf rose $3.61 YTD to a record high $109.42, still below the other major metros. On the other hand, Austin maintained the highest ppsf at $152.75 after rising nearly $3.00 through the first four months of the year. Prices moderated in North Texas, ticking down to $131.40 and $117.54 in Dallas and Fort Worth, respectively. At this time last year, the Dallas ppsf was gravitating towards Austin’s level but has since moderated to a more gradual trajectory. San Antonio exhibited a similar growth pattern inching up just 1 percent YTD to $112.59.
________________
*All monthly measurements are calculated using seasonally adjusted data, and percentage changes are calculated month over month, unless stated otherwise.