
Texas A & M Real Estate Center has released another informative report that I wanted to share with you. As always, if you have any questions or real estate needs, call me or email me at any time.
July 2018 Summary
Texas housing sales rebounded 3.8 percent, reaching a record level 29,456 homes sold through a Multiple Listing Service (MLS) after a sluggish first half of the year. The recently wavering $200,000-$300,000 price range accounted for most of the improvement. Housing demand strengthened across the price spectrum amid the state’s continued economic expansion. The four-month stretch of inventory increases ended as demand overpowered increases in supply-side activity. The rate of single-family housing construction significantly lags pre-recessionary peak levels. Home price appreciation calmed as construction shifted towards smaller homes and lot sizes. The moderation, however, failed to boost housing affordability as wages remained stifled.
Supply*
The Texas Residential Construction Cycle (Coincident) Index, which measures current construction activity, reached its highest level since 2008 as construction employment and wages elevated. This momentum should continue into fall as the Texas Residential Construction Leading Index (RCLI) extended its upward climb amid gains in single-family weighted building permits and decreased interest rates.
Second quarter private bank loan data indicated sustained levels of residential construction investment in Texas. Multifamily loan values dipped for the first time since 2013 but still hovered around record levels. Loans for one-to-four unit projects recovered first-quarter losses but remained slightly lower than in 2007.
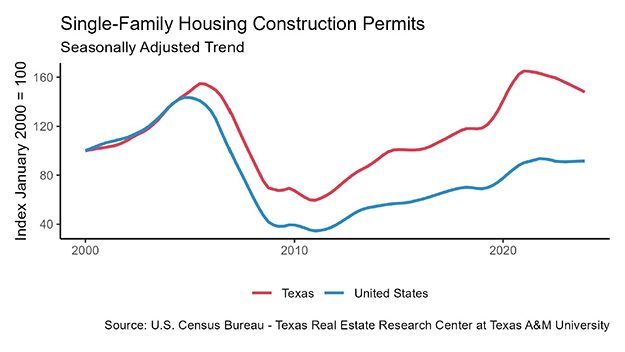
Single-family housing construction permits jumped 6.3 percent to a year-to-date (YTD) high of 10,396 after contracting in the second quarter. Texas remained the leader in permits issued, accounting for 16 percent of the national total. Houston and Dallas-Fort Worth topped the metropolitan rankings, issuing 3,589 and 3,144 nonseasonally adjusted permits, respectively. The monthly jolt, however, occurred in Austin where a decade-high 1,819 monthly permits pushed growth up 35 percent YTD. San Antonio also reached a ten-year record in permits issued with 743 but remained well below its pre-recessionary peak.
Total housing starts maintained an upward trend amid a spark in single-family activity in the Texas Urban Triangle. Increased development lifted single-family private construction values 6.2 percent, but the trend remained flat on the year.
The months of inventory (MOI) in Texas dropped to 3.6 months after four consecutive monthly upticks. Around six months of inventory is considered a balanced housing market. A drastic spike in MLS listings to start the year had supported the marginal inventory relief. That momentum, however, dissipated as the rate of new listings normalized. A rebound in sales activity after a sluggish second quarter also weighed on inventories.
Inventory improvements during the first half of the year occurred primarily for homes priced above $300,000 where supply is more stable. That momentum stalled in the $300,000-$500,000 price range during July. Inventory levels for homes priced below $300,000 remained extremely tight. In the $200,000-$300,000 range, the MOI held at just 3.1 months, while sinking to an all-time low of 2.7 months for homes priced below $200,000. In contrast, the MOI for homes priced above $500,000 reached its highest level of the year at 9.4 months.
The slowdown in new listings ended the inventory increase in the major metros. Austin suffered the starkest correction, dropping below 2.5 months after solid second-quarter gains. Dallas and Houston balanced around June levels of 2.8 and 3.8 months, respectively, while the San Antonio MOI dipped below 3.3 months. Fort Worth was the exception, where inventories elevated for the fifth consecutive month but still remained notably constrained below 2.4 MOI.
Demand
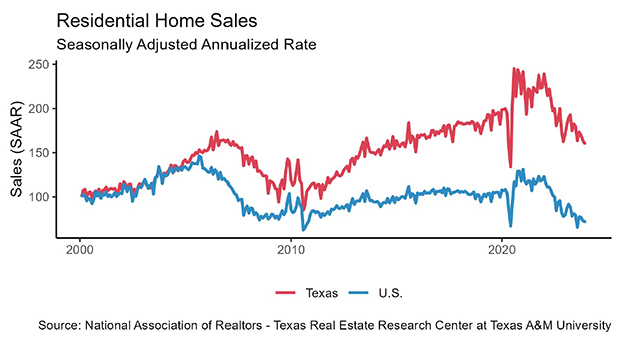
Housing sales rebounded 3.8 percent, reaching a record level 29,456 homes sold through an MLS after a sluggish first half of the year. New-home sales reported by Metrostudy, which are typically sold directly to the purchaser, posted strong gains in the second quarter, supporting the solid outlook. Increased activity occurred across the price spectrum, and the $200,000-$300,000 cohort accounted for nearly half of the July improvement. The previous five-month stretch of inventory increases in this price range provided room for the monthly sales growth.
Housing activity in July accelerated across all of the major metros. Sales jumped 7.2 percent in Fort Worth to a record high 3,113, accompanied by a 6 percent increase in San Antonio. Houston’s sales rose 1.3 percent, but transactions on previously owned homes remained flat. In Austin and Dallas, sales picked up 3.2 and 2.4 percent, respectively, but remained negative on the year.
Economic growth bolstered the demand for Texas homes. The average days on market (DOM) dropped to 56 days in July, decreasing in all but one month this year. Austin faced similar demand conditions with DOM at 54 days, while homes sold on average after 55 days in both Houston and San Antonio. The Dallas DOM rose to 44 days for the first time this year, led by slightly slower turnover on homes priced between $300,000-$400,000. Fort Worth homes sold the fastest in the state, flying off the market after an average of just 37 days.
Statewide, homes priced from $200,000 to $300,000 averaged 51 days on the market, on par with last year’s pace. Demand spilled into this price range as homebuyers struggled to find options priced below $200,000. The bottom price cohort (below $200,000) accounted for the largest proportion of sales through an MLS at 34 percent. In 2011, more than 72 percent of sales fell in this price range. Demand also heightened on the upper-end of the market (above $500,000) where the average home sold after 79 days, nearly a week faster than in July 2017.
Concerns regarding international trade pulled investments into safe assets, offsetting robust economic data and weighing on interest rates after they reached multiyear highs in May. The ten-year U.S. Treasury bond yield ticked below 2.9 percent for its second straight monthly decline. The Federal Home Loan Mortgage Corporation’s 30-year fixed-ratefell to 4.5 percent but remained 56 basis points above last year’s level, providing further challenges to housing affordability. At the national level, mortgage applications for new-home purchases rose 3.6 percent year over year (YOY) as more inventory hit the market.
Prices
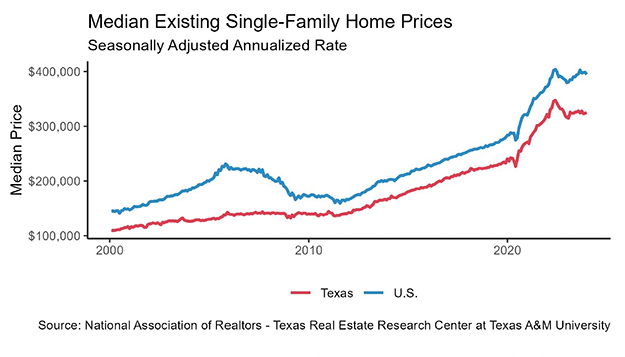
Home price appreciation moderated as a result of the supply uptick earlier this year and an increased appetite for smaller homes. The FHFA Housing Price Index for Texas rose 0.7 percent in the second quarter, the slowest rate since 2014. Nevertheless, the index indicated that Texas prices were 54 percent higher than in 2007. At the national level, home prices increased just 16 percent over the same period. In Austin and Fort Worth, the index decelerated to 0.5 and 0.6 percent, respectively, but remained 78 and 60 percent above pre-recessionary levels. Prices picked up 1.4 percent in Dallas after slowing in the first quarter, appreciating 71 percent since 2007. Energy sector activity supported Houston housing prices, which elevated 63 percent over the past 11 years. San Antonio’s price appreciation held below the state level at 44 percent over the same period but rebounded 1 percent in the second quarter.
Texas builders reduced home sizes to combat rising input costs and affordability constraints. The median square footage (sf) of new homes sold through an MLS settled at 2,301 sf, down 3 percent YOY. The median price per square foot (ppsf) rose 4.7 percent YOY to $115.81. At the metro level, Dallas ($132.29) and Houston ($108.25) recorded similar YOY growth at 4.6 percent. Fort Worth ($118.32) and San Antonio ($113.87) posted the largest growth over the past year at 6.9 and 5.6 percent, respectively. On the other hand, growth in the median ppsf decelerated in Austin but remained distinctly more expensive at $153.19.
________________
*All monthly measurements are calculated using seasonally adjusted data, and percentage changes are calculated month over month, unless stated otherwise.